Chia sẻ
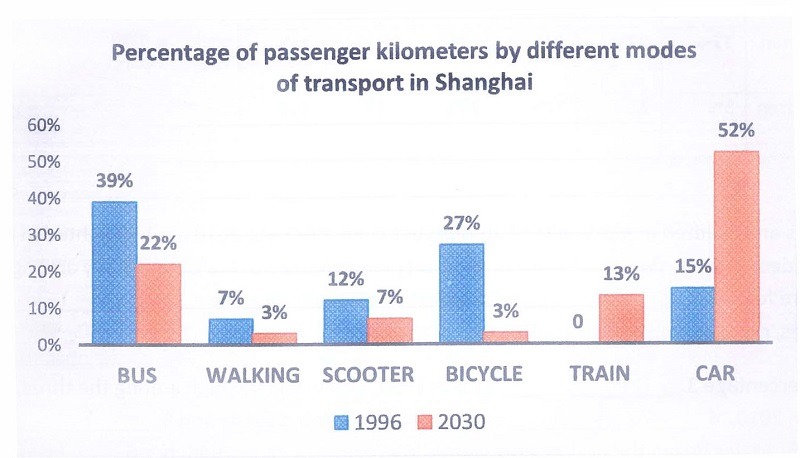
The diagram below gives information about the proportion of passenger kilometers travelled by different modes of transport in Shanghai in 1996 and one possible projection for their use in 2030.
Summarize the information by selecting and reporting the main features make comparisons where revevant.
KTDC IELTS Team
Nguồn: KTDC
Tag